
At the heart of the government’s industrial strategy is a commitment to increase overall UK investment in R&D to 2.4% of GDP in 2027. Currently investment stands at 1.67% of GDP. So this has got to be a good thing? Actually this target is not very ambitious when measured against comparable countries and this lack of ambition is likely to affect the future prosperity of people living in the UK.
A comparison between the UK, France and Germany using OECD data shows that the UK has invested less in R&D than France as a share of GDP since 1986 and less than Germany since 1980. These differences are large and have persisted over a long time. It is perhaps worth noting that the share of R&D spending in GDP for the United states has always been above 2.4% and recently has been at around 2.7%.
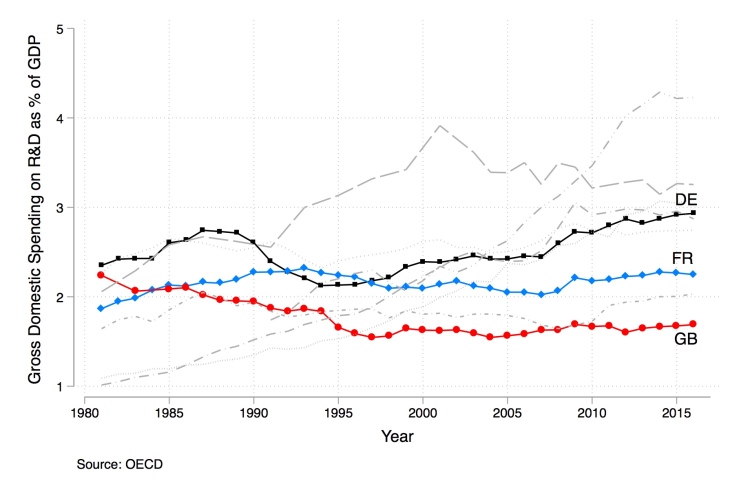
If the UK brings investment on R&D in the economy up to 2.4% that would mean it could overtake France’s level of R&D investment today and it would take the UK to the OECD average today. But Germany is aiming to invest 3.5% of its GDP in R&D by 2025 and multiple other countries in the EU (e.g. Austria, Sweden, Finland) already invest around 3% of GDP in R&D, so really the UK is running to stand still.
Two questions arise: i) does it matter that the UK has invested comparatively less in R&D than comparable countries and ii) why has this happened? Answers to these questions will lead to an answer to the central question above: will the industrial strategy deliver? To start answering both questions it is worth pointing out that there is a strong correlation between the level of government investment in R&D and the level of private investment in R&D, both of which then make up the total gross domestic spending on R&D shown in the figure above. The correlation of private and public investment is nicely shown in chart 1 of this blog post by Tom Forth. The correlation doesn’t prove that more government spending causes more private R&D, but a recent review of the literature suggests that government investment often does stimulate private investment. Mariana Mazzucato has also argued forcefully for a stronger role of government in the pursuit of innovation in her book: The Entrepreneurial State. Stronger government intervention is also urged in a recent report by the Industrial Strategy Commission. The level of UK government spending on R&D was analysed in great detail in a 2012 report, also with the conclusion that comparatively little was being spent on R&D in the UK.
So if lower government investment also contributed to lower private investment, what effects if any did this have on firms and the public in the UK? Some R&D leads to patentable inventions. Hence one might expect that lower R&D investment in the UK resulted in fewer patents granted to UK companies. Concerns about the number of patents filed by UK firms have been raised a number of times in previous years on IP Kat, by IP lawyers and in the national press. Our recent analysis of patenting in Europe focuses on granted patents and supports the conclusion that UK patenting has been in relative decline for a long period.
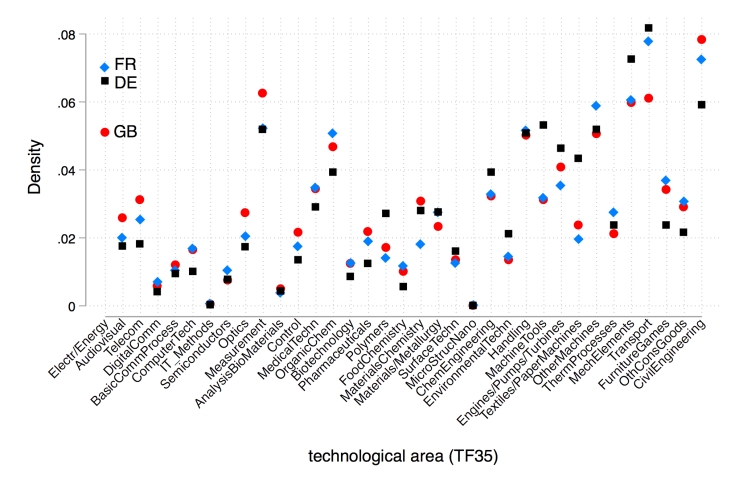
We began by comparing which technology fields were most important in the entire portfolio of patents granted by the European Patent Office (EPO) to firms from the UK, France and Germany before 2000. The comparison is set out in the figure above. There are clear differences across the three countries, with UK firms having a stronger concentration in Civil Engineering, Optics, some areas of Chemistry and of Electrical Engineering than the two other countries. The figure only illustrates in which technologies the UK portfolio is concentrated. Building on this we examined the growth of these portfolios. In the following graph we focus only on patents that are highly cited, as these tend to have greater economic impact. In our paper we also analysed the entire portfolio – our findings in both cases are very similar.
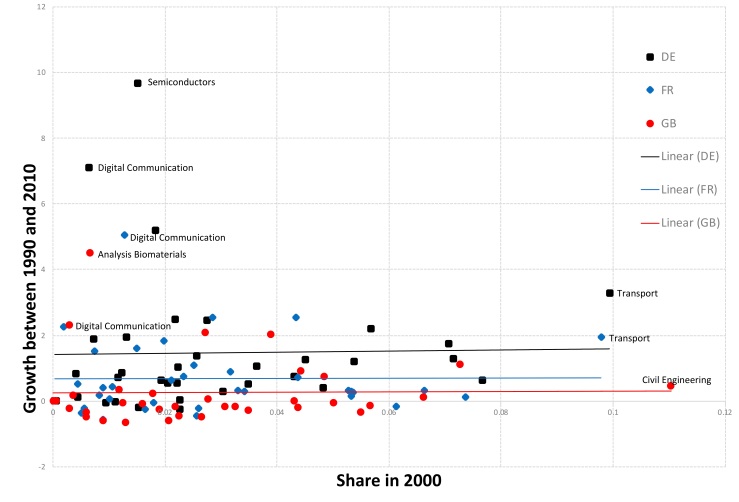
The figure below shows that the growth in patenting across all 35 technology areas in the portfolio of UK firms is lower than that of French or German firms. There is only one field – Analysis / Biomaterials – in which patenting growth of UK companies clearly stands out and in which the UK is leading the other two countries. Looking back at the literature on biotechnology it emerges that UK firms in this sector benefitted from the strong market focus of the UK economy, with much better access to venture capital. This is a model that did not work for most other sectors reliant on patents. The figure below demonstrates that patenting numbers for highly cited patents in many technology areas shrank for the UK, which is less often the case for the portfolios of German and French firms.
One might challenge the result by arguing that the three economies are of different size and that the share of manufacturing industries, which give rise to most patent applications, differs in each economy. Actually, we have found that the share of manufacturing in GDP for France and the UK has been remarkably similar since 1975. When comparing the number of granted and highly cited patents to GDP we obtain numbers for the UK that serve to underline the sense that the UK has not held step with either France or Germany in its ability to innovate in sectors reliant on the patent system.
| DE | FR | GB | |
| 1990 | 1967.30 | 2533.35 | 1172.60 |
| 2000 | 2259.04 | 1862.38 | 808.99 |
| 2010 | 3108.78 | 2707.56 | 828.28 |
Table 1: Highly cited patents per trillion, constant 2000 US $. Data on GDP from OECD.
The same ranking emerges from the EU’s Science, Research and Innovation Performance of the EU (SRIP) report 2018 where PCT patent applications are used. There is more detail on the way we count patents and which patents we count at the end of the blog. Some readers may be interested in those details.
In as much as patents end up underpinning the technological advantages of companies that produce successful products to be sold at home and exported around the world, this probably explains some of the trade deficit the UK has been running with Germany and France as well as the aggregate trade deficit the UK has with the world.
The UK does have strengths as is pointed out in work by Jonathan Haskel and co-authors, specifically its investment in intangible assets such as advertising and marketing of products is much higher than in Germany. But it isn’t much higher than in France. A recent report has also shown that the UK’s university sector does very well in international comparisons, but this does not translate into R&D performed by companies or into product market success. Hence the problem remains: the UK has underinvested significantly in R&D for a very long time and this very probably has reduced the ability of UK industry to compete in global product markets. This cannot be changed overnight as the planned increases of spending in R&D through the industrial strategy are already large. However, the UK should aspire to much bigger increases in R&D investment over the longer term. The question is whether it will?
This takes us back to the second question raised above – why has the UK fallen behind France and Germany as well as several smaller EU countries to such an extent and for such a long time? One answer could be the level of tax revenue collected by the Treasury. Political discourse between the largest parties in the UK often revolves around the level of taxation and the notion that government tends to use funds wastefully. This argument is much weaker in France or Germany, as voters tend to associate it with attempts to cut back on welfare spending. The figure below shows that at about the same time that the UK fell behind France and Germany in terms of the share of GDP invested in R&D it also reduced the share of GDP that was collected as tax. This is probably not a coincidence. All three countries devoted and still devote a significant share of tax revenue to the welfare state as do Austria, Sweden and Denmark (all in the background in grey).
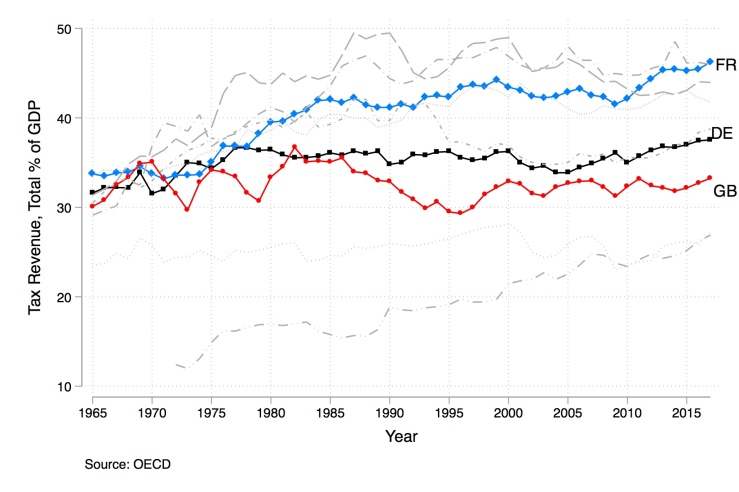
The IP statistics discussed in this blog show that cutting taxes and specifically corporate taxes has not increased firm spending on R&D sufficiently to compensate for lower government spending as a share of GDP relative to other European economies – note: the first figure above plots total government and private spending on R&D as a share of GDP. The figure just above also includes the United States and Korea, both of which have a lower share of tax revenue in GDP and a higher share of R&D investment in GDP than the UK, but of which also have less generous welfare systems.
This blog has focused heavily on patents as an indicator of R&D outputs. To the extent that productivity growth and jobs can be generated in sectors that do not rely on patent protection, such as software, finance, retail or real estate it may not matter that the UK performs poorly in patenting. But culturally and politically the poor performance of the country in sectors that focus on making physical products does seem to have resonance, underpinning some of the political dynamic towards Brexit, as exemplified in a recent article in the Guardian: “But there is also an element that ought to attract empathy: a yearning for a world in which men were steelworkers, coalminers and welders, and a desperate quest for something – anything – that might allow their successors to do the same.”
There is also a more analytical question that remains open: to what extent are high-value added services complements to physical products that would typically attract patent protection. If such products will remain important, then patent counts will continue to provide an important window onto future prosperity. An example would be data collected on the performance of airliners and their turbines, which increases efficiency of maintenance of these machines. Similarly, efforts to improve fuel efficiency, reduce CO2 and other emissions and introduce the capability for autonomous driving into ground transportation are the source of hardware and software innovations that are closely linked. It seems likely that government intervention to support innovation in these fields will remain important.
More Detail on Patent Counts
A reader commented that many patent applications are made to national patent offices. The data presented above is for patents granted by the European Patent Office (EPO) and does not include national patents. If companies in some countries rely more heavily on their national office, this would skew the EPO patent statistics. In our paper we analyse both the data from national patent offices and that from the EPO. The following graph underlines that the trend for patent applicants from the UK at both types of offices differs markedly to the trend for applicants from France, Italy and Germany. In contrast, to the graphs above we focus on patent applications (not granted patents) here.
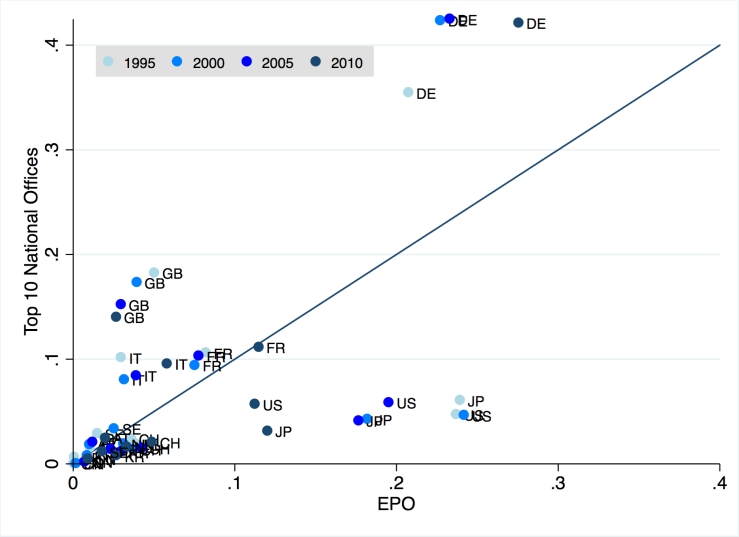
While it is true that UK applicants have a much larger share of applications within the largest 10 national offices in Europe than they have at EPO, this share has also been falling steadily since 1995. Meanwhile applicants from France and Italy are increasing their share of national and EPO applications steadily since 2000.
In response to these data Stuart Graham at Georgia Tech analysed US patent data and found that patent grants to UK firms fall behind those of firms from France and Germany after 2005:
| 1995 | 2000 | 2005 | 2010 | 2011 | 2012 | 2013 | |
| DE | 6,958 | 10,729 | 11,499 | 16,317 | 17,579 | 20,798 | 22,638 |
| FR | 2,034 | 2,606 | 2,294 | 4,027 | 4,275 | 5,303 | 6,180 |
| GB | 1,775 | 2,481 | 3,296 | 3,857 | 3,659 | 4,172 | 4,448 |
| Growth | |||||||
| 5-year △ | 5-year △ | 5-year △ | 1-year △ | 1-year △ | 1-year △ | ||
| DE | 54% | 7% | 42% | 8% | 18% | 9% | |
| FR | 28% | -12% | 76% | 6% | 24% | 17% | |
| GB | 40% | 33% | 17% | -5% | 14% | 7% | |

Reblogged this on Centre for Globalisation Research Blog.
LikeLike
Thanks for this provocative post, Georg. To provide a bit more information on the final table, I was intrigued when Georg first mentioned to me what he was seeing in his data, and so I took his observation to the US patent grants data (extracted from http://www.patentsview.org, an initiative of the USPTO Chief Economist Office), and reported US patent grants assigned to non-US entities (primarily corporations) in the years indicated. Note that data after 2013 are bounded due to pending applications at the USPTO, so may not provide reliable reflections. Also the counts in the table should be viewed as a first look, and as such ought to act as a starting point for more rigorous exploration of the phenomenon they appear to indicate. Thanks to Georg for doing some of that harder work, and describing his findings in this post.
LikeLike
Reblogged this on Centre for Globalisation Research Blog.
LikeLike